
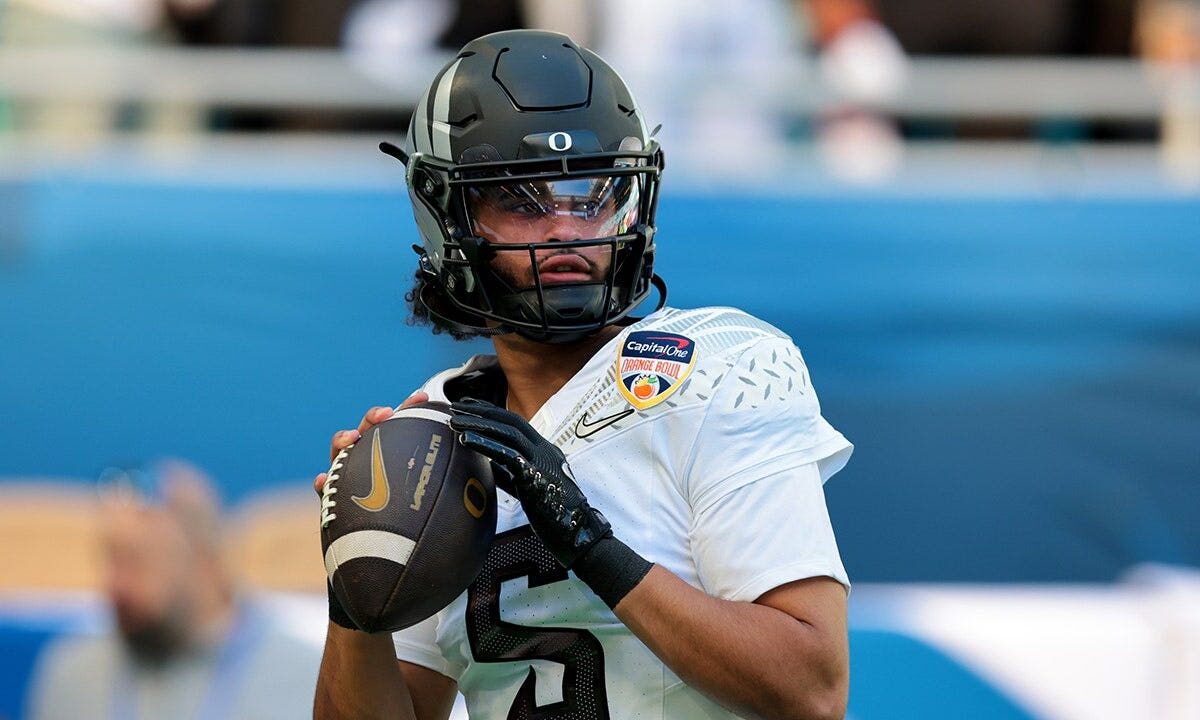
SP+ projections — the efficiency-based ratings developed by Bill Connelly and hosted by ESPN — place the Oregon Ducks among the nation’s top teams heading into the next season. Those model-driven forecasts, when combined with returning-production metrics, create a plausible analytical case that Oregon could challenge established powers such as Indiana and Ohio State in the Big Ten.
Below we outline the SP+ view, the roster continuity numbers behind the projection, what reporting says about Oregon’s 2025 losses, the schedule tests that will define the season and the data sources behind the analysis. All projections referenced here are probabilistic outputs from SP+ and related returning-value work by ESPN’s Bill Connelly; they are predictive tools, not guarantees.
SP+ view: Oregon Ducks near the top
Per SP+ projections (Bill Connelly/ESPN), Oregon ranks among the top teams in efficiency across offense, defense and special teams. In many recent SP+ snapshots the Ducks appear inside the top tier nationally, with Ohio State often projected at or near No. 1 and Oregon frequently listed directly behind or near that mark.
SP+ blends play-by-play efficiency, opponent adjustments and returning-player carryover to produce season forecasts. Those outputs are useful baseline expectations — they describe what the statistical model estimates is most likely, given current inputs and assumptions — but they cannot account for every in-season contingency.
Roster continuity and returning production
Roster continuity is a central reason SP+ and other analytics favor Oregon. ESPN/Bill Connelly’s returning-value analysis (the “returning production” metric) quantifies how much of a team’s prior-season production returns via starters and top contributors. Reporting aggregating those numbers shows Oregon returning roughly two-thirds of its production from the prior year.
As reported in the Fox News item summarizing the SP+/ESPN data, the returning-production figures reported were approximately: Oregon ~66%, USC ~65%, Ohio State ~60% and Indiana ~56%. These percentages are drawn from ESPN’s returning-value analysis as cited in that coverage; they help explain why models project relative stability or volatility for each program.
Quarterback Dante Moore is one of the higher-profile retained contributors cited in coverage of Oregon’s retained production. Returning established starters reduces the offseason uncertainty and typically improves early-season execution, factors that feed into SP+ carryover assumptions.
What the 2025 losses reveal
Multiple outlets summarizing SP+/ESPN coverage note that Oregon’s two losses in 2025 came against Indiana. The Fox News story that aggregated the SP+/ESPN reporting states Indiana finished the season 16-0 and won the national championship; that characterization is attributed to the cited reporting rather than asserted here as an independent verification.
Viewed through an analytical lens, losses to the conference’s top team (as reported) can temper how much weight to place on a model’s favorable projection: head-to-head outcomes highlight matchup gaps that year-to-year metrics alone may not fully capture. At the same time, losing to a dominant conference opponent does not, by itself, contradict the idea that roster continuity and efficiency could make Oregon better positioned the following season.
Key schedule tests that will define the season
Even with favorable SP+ placements and strong returning-production percentages, Oregon’s path will be determined by several high-leverage games. The schedule items flagged by analysts include a road trip to USC, a road game at Ohio State, home dates against Michigan and Nebraska, and the rivalry game with Washington at Autzen.
Road environments at USC and Ohio State represent the stiffest single-game tests: SP+ can rate expected performance, but hostile venues and single-game variance can swing results. Home tests against Michigan and Nebraska will indicate whether Oregon can consistently close tight contests; the Washington game remains a rivalry barometer regardless of rankings.
Why it matters for the Big Ten race
If Oregon sustains SP+–projected efficiency and its returning production converts into wins, the Ducks could reshape the Big Ten’s upper tier. Ohio State commonly sits atop national projections, and Indiana’s recent reported success maintains its profile. But the combination of carryover and efficiency gives Oregon tangible upside in preseason models.
It’s important to restate that projections are not certainties. Injuries, transfers, development curves and special-teams variance (a common swing factor) can alter outcomes quickly. SP+ offers a probabilistic forecast; readers should treat it as an informed expectation rather than a definitive result.
By the numbers
- Oregon returning production (ESPN/Bill Connelly, as cited): ~66%
- USC returning production (as cited): ~65%
- Ohio State returning production (as cited): ~60%
- Indiana returning production (as cited): ~56%
- SP+ placement (sample snapshots): Oregon projected near the top nationally; Ohio State frequently shown at No. 1
What comes next for the Ducks
Early practices, camp reports and nonconference tune-ups will reveal how Oregon replaces any departed contributors and whether younger players can close experience gaps. Coaching continuity under Dan Lanning and a returning quarterback room are analytical advantages the SP+ inputs recognize; translating that into consistent three‑phase performance will be the practical test.
Ultimately, the season will be decided in the key schedule windows identified above. If the Ducks win the high-leverage games the models expect them to contend in, projections will be validated; if not, the same model inputs will be questioned and likely adjusted for next year.
Method and source attribution
This analysis is built from SP+ projections and Bill Connelly’s returning-value (returning-production) metrics as reported by ESPN and summarized in the Fox News piece cited below. SP+ is a statistical model that blends play-level efficiency, opponent adjustments and carryover assumptions to produce probabilistic season forecasts; it is not a guarantee of outcomes.
Primary sources referenced: SP+ projections (ESPN/SP+, Bill Connelly) and the Fox News summary of that reporting. See SP+ on ESPN: ESPN SP+, and the Fox News summary: Is another team ready to take over the top of the Big Ten from Indiana and Ohio State? (Fox News).
Frequently asked questions
How do SP+ projections rank the Oregon Ducks?
SP+ places Oregon among the nation’s upper tier in many recent snapshots, with the model often showing the Ducks near No. 2 nationally in efficiency metrics. These outputs are model projections, not guarantees.
Did Oregon lose to Indiana in 2025?
Coverage summarizing SP+/ESPN reporting indicates Oregon’s two losses in 2025 were to Indiana. The characterization that Indiana finished 16-0 and won the national championship is attributed to the cited reporting; this piece presents that claim as reported by those sources.
How much returning production does Oregon have and who leads it?
Per ESPN/Bill Connelly’s returning-value figures as cited in the Fox News summary, Oregon returns about 66% of its prior-season production, with quarterback Dante Moore among the leading returning contributors.
Source: SP+ projections and ESPN/Bill Connelly returning-value metrics, as reported and summarized in the linked Fox News coverage.

